
Hiring metrics are quantifiable measurements that reveal exactly how efficient and effective your recruitment process is, and knowing how to understand hiring metrics is the first step toward fixing what's costing you time and money. The formal industry term for this practice is talent acquisition analytics, and it covers everything from how long a role sits open to whether your new hires actually stay. For small businesses in trades like HVAC, electrical, plumbing, pool service, or retail, these numbers are not abstract HR concepts. They are the difference between a fully staffed crew and a job site running short. This article breaks down the five metrics that matter most, how to calculate them, and how to act on what they tell you.
How to understand hiring metrics: the five that actually matter

Tracking too many metrics causes analysis paralysis, and the research is clear that focusing on five core KPIs produces better recruitment outcomes than chasing a dashboard full of numbers. That is good news for small business owners who do not have a dedicated HR team. The five metrics worth your attention are Time to Fill, Time to Hire, Cost per Hire, Quality of Hire, Source of Hire, and Offer Acceptance Rate.
Here is what each one means in plain terms:
- Time to Fill is the number of calendar days between posting a job and having a signed offer. It measures how fast your pipeline moves from start to finish.
- Time to Hire is narrower. It counts only the days between a candidate's first application and their accepted offer. This tells you how long your process takes once someone is in the funnel.
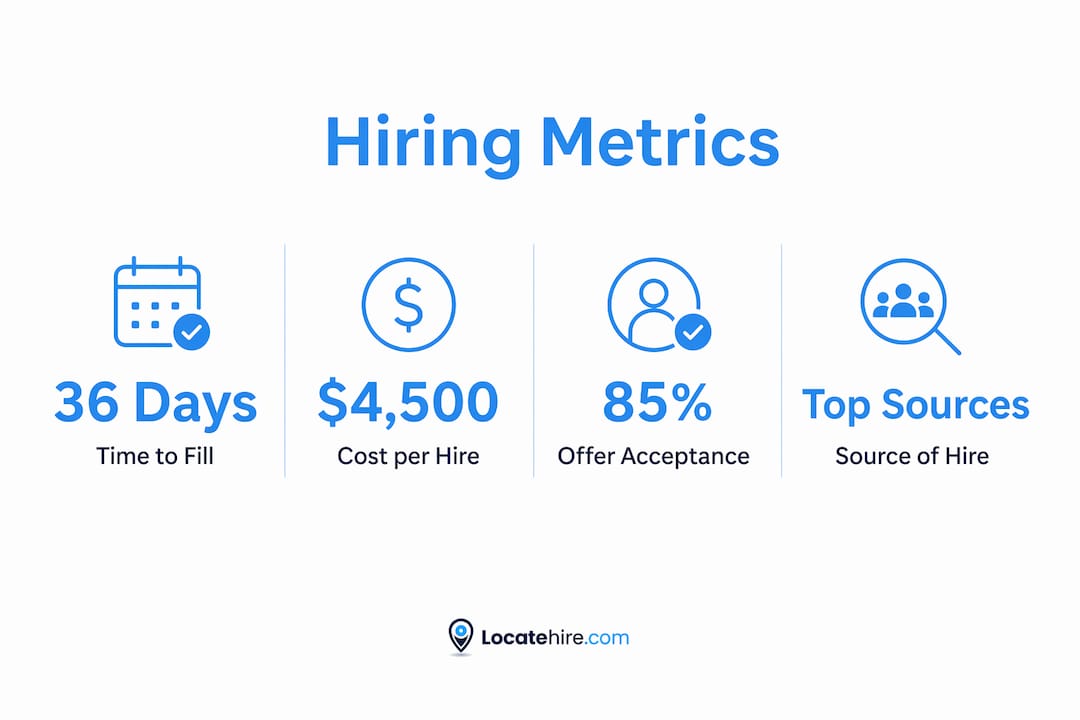
- Cost per Hire adds up every dollar spent to fill a role: job board fees, recruiter time, background checks, and onboarding costs. The average cost per hire in the U.S. sits at $4,700, and it more than doubles for specialized roles. For a plumbing company hiring a licensed journeyman, that number can exceed $9,400.
- Quality of Hire combines performance scores, manager ratings, and first-year retention to give you a single signal about whether you hired the right person. Retailers who improved this metric saw a 15% increase in sales per associate, which shows the direct business impact.
- Source of Hire tracks which channel produced each hire: job boards like Indeed, employee referrals, trade school partnerships, or staffing agencies. Referrals and specialized partners consistently outperform generic job boards in both quality and retention.
- Offer Acceptance Rate is the percentage of offers extended that candidates actually accept. A low acceptance rate signals a compensation mismatch or a poor candidate experience, both of which are fixable once you know they exist.
Pro Tip: Start tracking only these five. Add more only after you have 90 days of clean data on the basics.
How do you measure and benchmark these metrics accurately?
Measurement without a reference point is just a number. Benchmarks turn that number into a verdict. Here is how to calculate each metric and what the 2026 industry standards say about where you should land.
- Calculate Time to Fill. Subtract the job posting date from the offer acceptance date. The industry average is 36 days. If your HVAC technician role takes 60 days to fill, that gap points to a specific bottleneck: too few applicants, a slow interview process, or an uncompetitive offer.
- Calculate Cost per Hire. Add all internal costs (recruiter hours at their hourly rate, manager interview time) to all external costs (job board fees, background checks, drug screens). Divide by the number of hires in the period. Compare against the $4,700 national average to see where you stand.
- Calculate Quality of Hire. Use a simple formula: (Performance Score + Retention Rate + Hiring Manager Satisfaction) divided by 3. Score each component on a 0 to 100 scale. A score above 70 is generally considered strong for trade and service roles.
- Identify Source of Hire. Ask every new hire how they found the role, or pull the data directly from your applicant tracking system (ATS). Segment results by channel and compare 90-day retention rates across sources.
- Calculate Offer Acceptance Rate. Divide accepted offers by total offers extended, then multiply by 100. An acceptance rate below 80% is a warning sign worth investigating.
| Metric | Calculation | 2026 Benchmark |
|---|---|---|
| Time to Fill | Offer date minus posting date | 36 days |
| Cost per Hire | Total spend divided by hires | $4,700 |
| Quality of Hire | Average of performance, retention, satisfaction | 70+ out of 100 |
| Offer Acceptance Rate | Accepted offers divided by total offers | 80% or higher |
| Source of Hire | Hires per channel as a percentage | Referrals lead |
Manual tracking is error-prone, and modern applicant tracking systems automate data capture so you get real-time numbers without a spreadsheet. If you are still logging candidates in a shared Google Sheet, you are creating the conditions for bad data and bad decisions. Tools built for small business recruitment software capture this data automatically at each stage of the hiring funnel.
What is the difference between activity metrics and outcome metrics?
This distinction is where most small business owners go wrong with hiring data analysis. Activity metrics show recruiter effort; outcome metrics show whether that effort produced results. Confusing the two leads to optimizing for the wrong things.
Activity metrics include:
- Number of resumes reviewed
- Number of interviews scheduled
- Number of job postings published
- Calls made to candidates
These numbers tell you how busy your process is. They do not tell you whether it is working. A recruiter who reviews 200 resumes and hires one person who quits in 60 days has strong activity metrics and terrible outcome metrics.
Outcome metrics include:
- Quality of Hire
- First-year retention rate
- Time to productivity (how long before a new hire works independently)
- Offer acceptance rate
Pro Tip: If a metric does not connect to a business result like retention, productivity, or revenue, treat it as a secondary number. Review it monthly, not weekly.
The risk of tracking too many activity metrics is real. Analysis paralysis sets in when you have 20 numbers to review and no clear signal about what to change. For a janitorial company or a retail operation running lean, the answer is to anchor your review process to outcome metrics and use activity metrics only to diagnose why an outcome metric is off.
How can you apply hiring metrics to improve your recruitment results?
Understanding the numbers is step one. Using them to make decisions is where the return on investment appears. Here is a practical sequence for applying hiring data analysis to your actual hiring process.
- Identify your biggest bottleneck first. Pull your Time to Fill data and break it into stages: days to first application, days to first interview, days from interview to offer. The longest stage is your constraint. A broken hiring process in trades often shows up as a multi-week gap between application and first contact.
- Redirect budget toward your best source of hire. If your Source of Hire data shows that employee referrals produce hires who stay 40% longer than Indeed applicants, shift your spending accordingly. A referral bonus program costs less than repeated job board fees.
- Use Quality of Hire to refine your screening criteria. If your top performers all came from a specific trade school or certification program, build that into your job requirements. If your worst hires all lacked a specific skill, add a screening question for it.
- Fix your offer acceptance rate before you fix your sourcing. A low acceptance rate means you are losing candidates after doing all the work to find them. Review your compensation against market rates using Bureau of Labor Statistics data for your trade and region. Then look at your candidate experience: how long does your process take, and how communicative are you during it?
| Problem | Metric to check | Action to take |
|---|---|---|
| Roles stay open too long | Time to Fill | Identify the slowest stage and cut it |
| Hiring costs are rising | Cost per Hire | Audit channel spend and referral program |
| New hires leave quickly | Quality of Hire + retention | Tighten screening and onboarding |
| Candidates decline offers | Offer Acceptance Rate | Review compensation and communication speed |
Tracking multiple job openings simultaneously adds another layer of complexity. When you are hiring a pool technician, a retail shift supervisor, and an HVAC apprentice at the same time, your metrics need to be segmented by role. Aggregated numbers hide role-specific problems.
Key takeaways
Effective hiring decisions for small businesses require five core metrics, accurate benchmarks, and a clear focus on outcome data over activity data.
| Point | Details |
|---|---|
| Five core metrics | Track Time to Fill, Cost per Hire, Quality of Hire, Source of Hire, and Offer Acceptance Rate. |
| Benchmark against industry data | The 36-day time-to-fill and $4,700 cost-per-hire averages are your starting reference points. |
| Outcome metrics over activity metrics | Retention and Quality of Hire reveal hiring success; resume counts and calls made do not. |
| Source of hire drives budget decisions | Referrals and specialized partners outperform generic job boards in quality and retention. |
| Automate data capture | ATS tools eliminate manual tracking errors and give you real-time numbers to act on. |
Why most small businesses are measuring the wrong things
I have worked with enough small business owners to know that the first instinct when hiring goes wrong is to post more jobs and interview more people. More activity. The problem is that activity is not the issue. The issue is almost always one of three things: the wrong channel, a slow process, or a compensation gap. And you cannot see any of those without the right outcome metrics.
The businesses I have seen make the fastest improvements are the ones who stopped tracking everything and committed to three numbers: Time to Fill, Quality of Hire, and Offer Acceptance Rate. Those three tell you whether you are finding people fast enough, hiring the right ones, and closing them effectively. Everything else is context.
The other shift that matters is moving from manual tracking to an ATS. I understand the hesitation. It feels like overhead for a 10-person operation. But the cost of bad data is higher than the cost of the software. When you are struggling to recruit top talent in a tight labor market, you cannot afford to make sourcing or compensation decisions based on gut feel. The data has to be clean and current.
One more thing: metrics are not a report card. They are a diagnostic tool. The goal is not to hit a benchmark. The goal is to understand why you are not hitting it and then fix the specific thing that is causing the gap. That mindset shift is what separates businesses that improve their hiring from those that just measure it.
— Jeff
See your hiring metrics in real time with Locatehire
Locatehire is an applicant tracking system built specifically for small businesses with ongoing hiring needs, including pool service, HVAC, electrical, plumbing, janitorial, and retail operations. The platform captures your key hiring performance indicators automatically at every stage of the funnel, so you always know your Time to Fill, Cost per Hire, and Source of Hire without touching a spreadsheet.
Locatehire's built-in analytics flag bottlenecks before they become expensive delays, and the sourcing data shows you exactly which channels are producing your best hires. If your offer acceptance rate drops, the system surfaces it immediately so you can respond. For small businesses that need to hire fast and hire right, Locatehire's AI-powered recruitment platform turns raw hiring data into decisions you can act on today.
FAQ
What are the most important hiring metrics for small businesses?
The five most important hiring metrics are Time to Fill, Cost per Hire, Quality of Hire, Source of Hire, and Offer Acceptance Rate. Focusing on these five core KPIs produces better outcomes than tracking a larger set of numbers.
What is a good time-to-fill benchmark for 2026?
The industry average time to fill is 36 days. Roles that take significantly longer than this indicate a bottleneck in sourcing, screening, or offer speed that is worth investigating.
How do I calculate cost per hire for my small business?
Add all internal costs (recruiter and manager time) to all external costs (job board fees, background checks, onboarding), then divide by the number of hires in the period. The U.S. average is $4,700 per hire.
What is the difference between Time to Fill and Time to Hire?
Time to Fill measures the full period from job posting to accepted offer. Time to Hire measures only the days between a candidate's first application and their accepted offer, which isolates the speed of your internal process.
Why is my offer acceptance rate low?
A low offer acceptance rate typically signals a compensation mismatch, a slow hiring process, or poor communication during the candidate experience. Reviewing your pay rates against Bureau of Labor Statistics data for your trade and region is the fastest first step.